In spring of 2011 Belfast Interface Project commissioned a piece of research carried out by the Institute for Conflict Research to identify and classify the known security barriers and associated forms of defensive architecture in residential areas of Belfast.
This interfaces map and database — provides a comprehensive listing with photographs and descriptions of security barriers and defensive use of space throughout the city, organised geographically by cluster — draws heavily upon the final research report produced by ICR and brings together photos and information from past BIP research projects including those undertaken by Frankie Quinn in 2005 and ICR in 2008.
Overview of Defensive Architecture
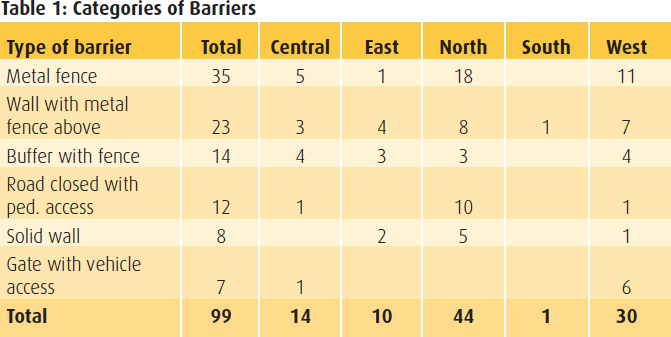
1. Categories and Locations of Barriers
The report identifies 99 different security barriers and forms of defensive architecture across the city associated with residential areas. These include:
- 35 barriers which are made of different styles of metal fencing
- 23 barriers which are comprised of a mixture of a solid wall with metal fencing above
- 14 examples of a mixture of fences with vegetation which act as a buffer
- 12 locations where roads have been closed to vehicles while allowing pedestrian access
- 8 locations where there is a wall alone, and
- 7 locations where roads have gates which are closed occasionally
Table 1 sets out the broad locations of these 99 barriers across the city:
- 44 barriers are situated in North Belfast – defined as the area north of Crumlin Road and west of Belfast Lough
- 30 barriers are in West Belfast – south of Crumlin Road and west of the Westlink and M1 motorway
- 14 are in the Central Area – defined as immediately adjacent to the Westlink and Inner Ring roads
- 10 are in East Belfast - east of the River Lagan and Belfast Lough
- there is 1 barrier in South Belfast – east of the Dublin railway line, south of the city centre and west of the River Lagan
2 Clusters
The different structures and blighted spaces are contained within 13 different ‘clusters’ — groupings of distinct and separate but related instances of defensively used space within the city — similar to the main interface areas identified by the NIHE in their internal review of interface areas carried out in 2006.
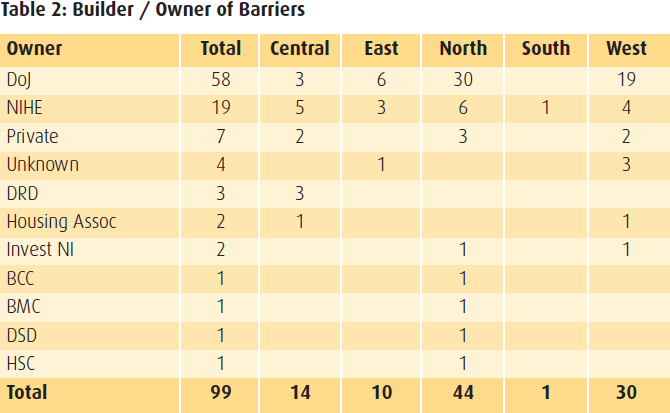
3. Ownership
The research also identified 10 different owners of the various structures (Table 2). The largest number of barriers (58) are owned by the Department of Justice (who inherited them from the Northern Ireland Office following devolution of policing and justice powers in 2007), 19 are owned by the Northern Ireland Housing Executive, 7 appear to be in private ownership, and 3 belong to the Department for Regional Development. To date it has not been possible to identify the owners of 4 of the barriers.
4. Date of Construction
It proved difficult to get detailed information on the dates when the barriers were constructed. Table 3 is based largely on data for those barriers constructed by the NIO, which are now the responsibility of the DoJ. The table shows that barriers have been constructed steadily since 1969, with most barriers constructed through the 1990s – 12 were constructed prior to the 1994 ceasefires and 14 in the second half of the decade.
The figures also indicate that one third of those barriers for which we have the construction date have been built since the ceasefires. The figures in brackets refer to the number of barriers that have been subjected to rebuilding or extension during the relevant decade. The figures for which we have dates indicate the rebuilding of 21 barriers, mostly under reconstruction since 2000.
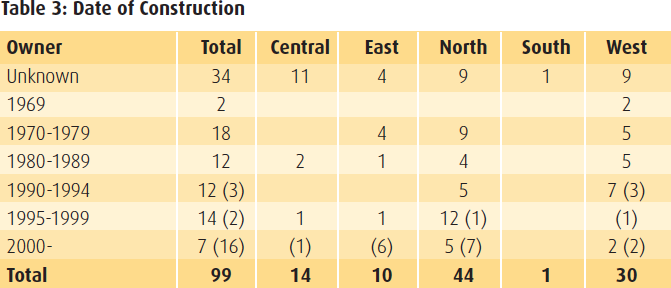
The figures also illustrate different patterns of construction in different parts of the city. The vast majority of the barriers in central, East and West Belfast were constructed prior to the ceasefires while in contrast half of the barriers in North Belfast have been constructed since the ceasefires were declared in 1994.
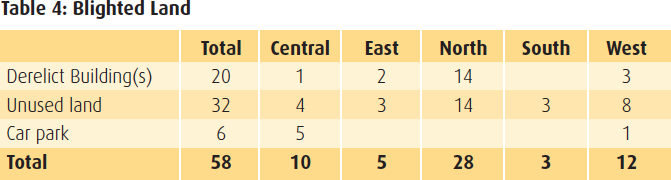
5. Blighted Land
The report also includes a number of examples of blighted land which are immediately adjacent to an interface barrier. The 58 examples include 20 areas where there are 1 or more derelict properties (in some cases there are numerous such properties plus empty plots of land), 32 locations where land remains unused and 6 sites which are currently used as car parks. At best this is a conservative list of unused or underused land in the immediate vicinity of an interface.